talks, code, tools, etc.
talking

coding
autognet: R package for estimation of causal direct and spillover effects in network data.
frontdoorpiie: R package for estimation of the Population Intervention Indirect effect
Syndromic surveillance: code to perform time series modeling on monthly indicator data and create data visualizations.
LQAS-IMP: code to create a Lot Quality Assurance Sampling (LQAS) system when a diagnostic test has imperfect accuracy.
visualizing

Interactive dashboard for City of Holyoke COVID-19 Cases & Deaths
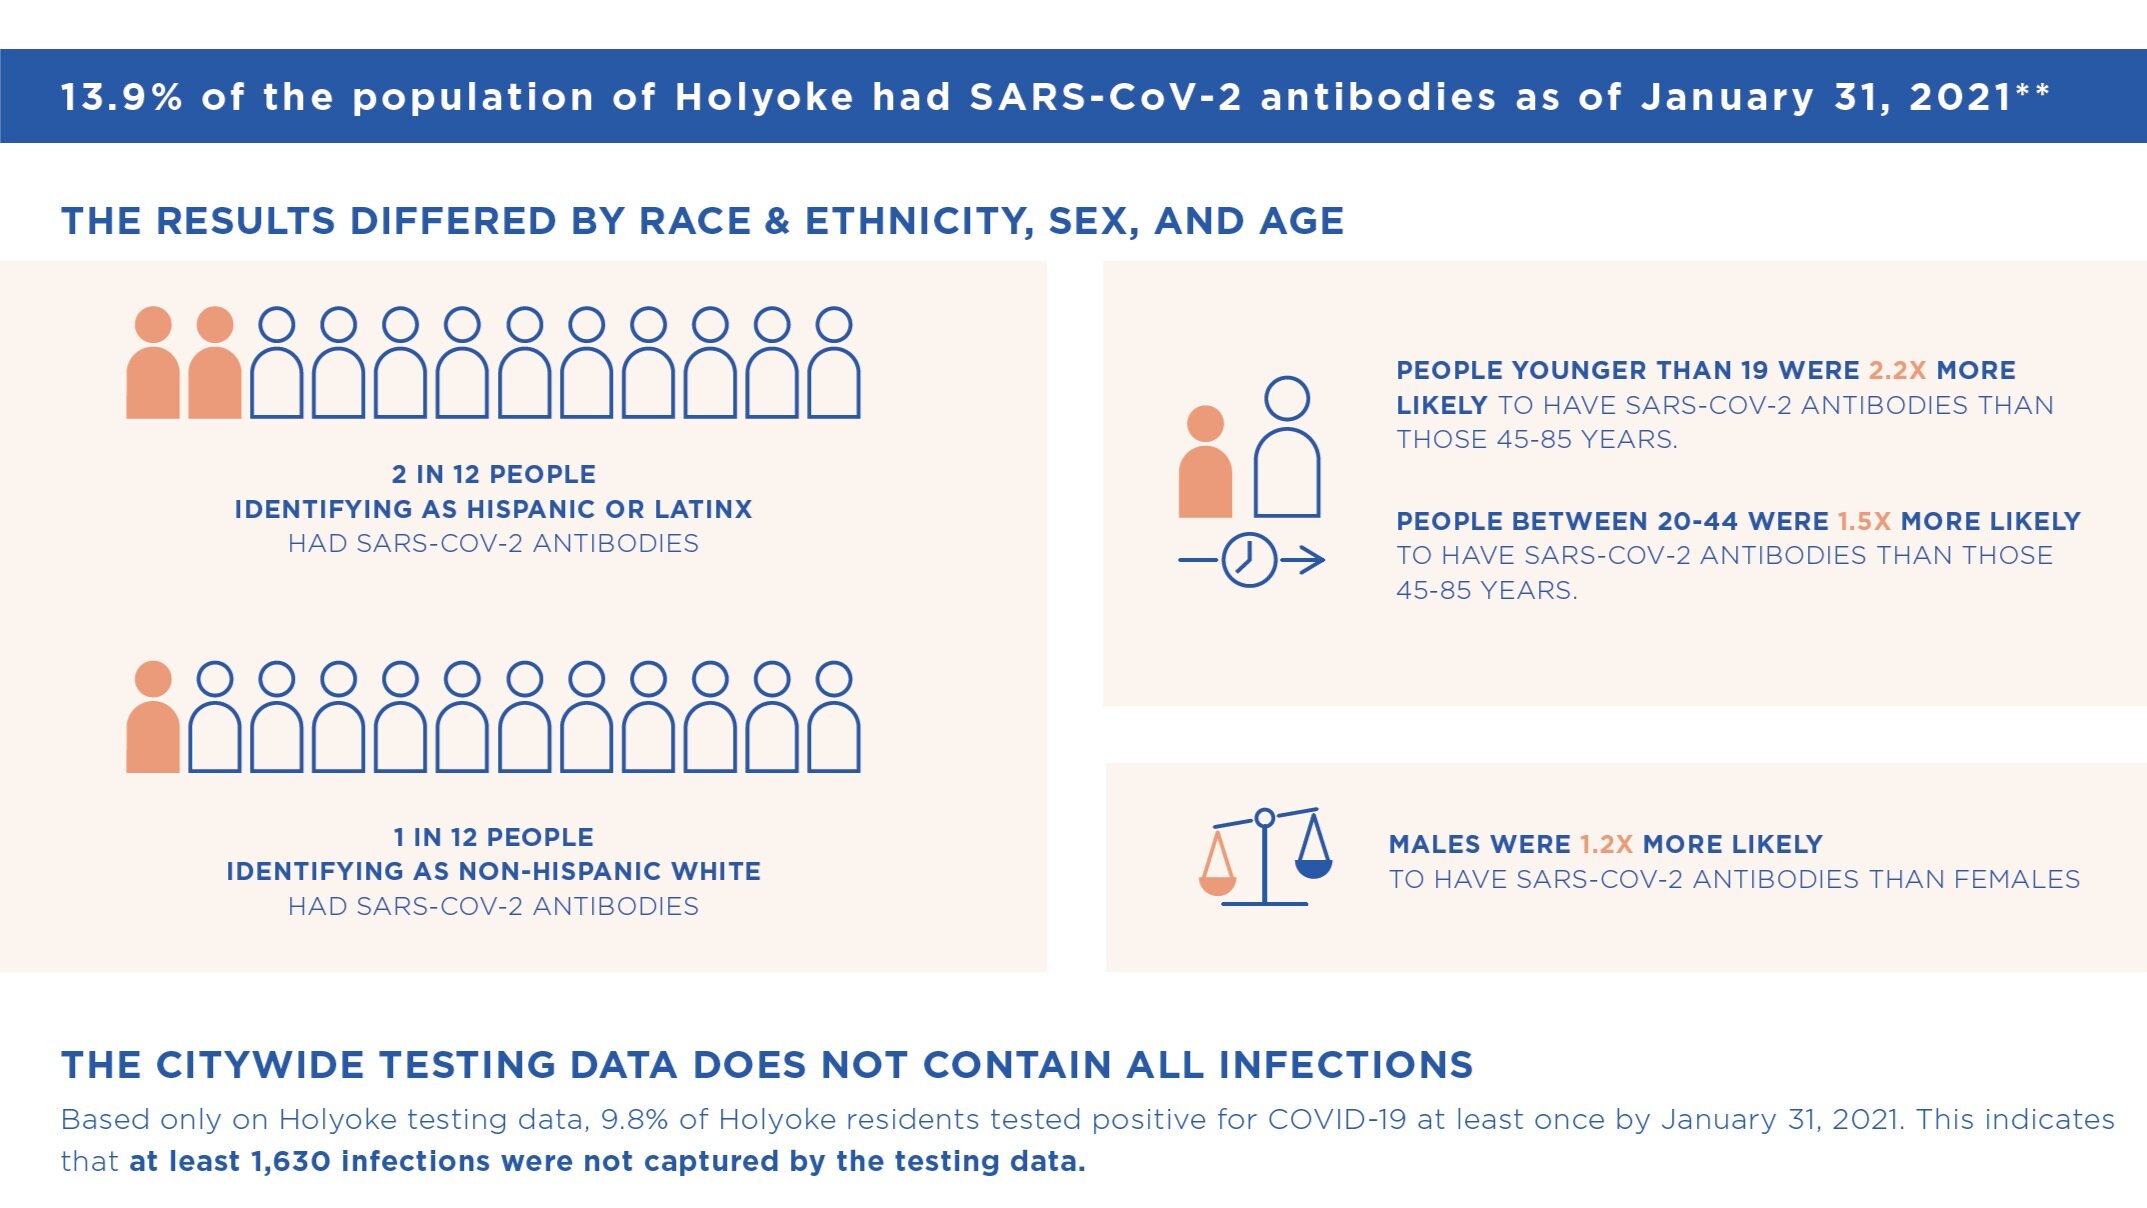
Infographic for City of Holyoke SARS-CoV-2 Seroprevalence Study Results

Interactive dashboard for Number of Averted Clinical Contacts under Repeal of Abortion Restrictions
teaching
An introduction to concepts in time series modeling, data visualization, and data cleaning with a particular focus on syndromic surveillance using routine health systems data during COVID-19. Course lecture slides, videos, and lab exercises are all publicly available.
An introduction to Stata for incoming graduate students at the Harvard T.H. Chan School of Public Health. Link includes handout with introductory videos.
A course for incoming biostatistics doctoral students at Harvard University. We covered the following statistical topics: maximum likelihood estimation, bootstrap, and basics of simulation studies. Link includes lectures slides and exercises in R (with solutions).